Election Data Visualization
An interactive visualization of Swedish elections developed for a course at Linköping University.
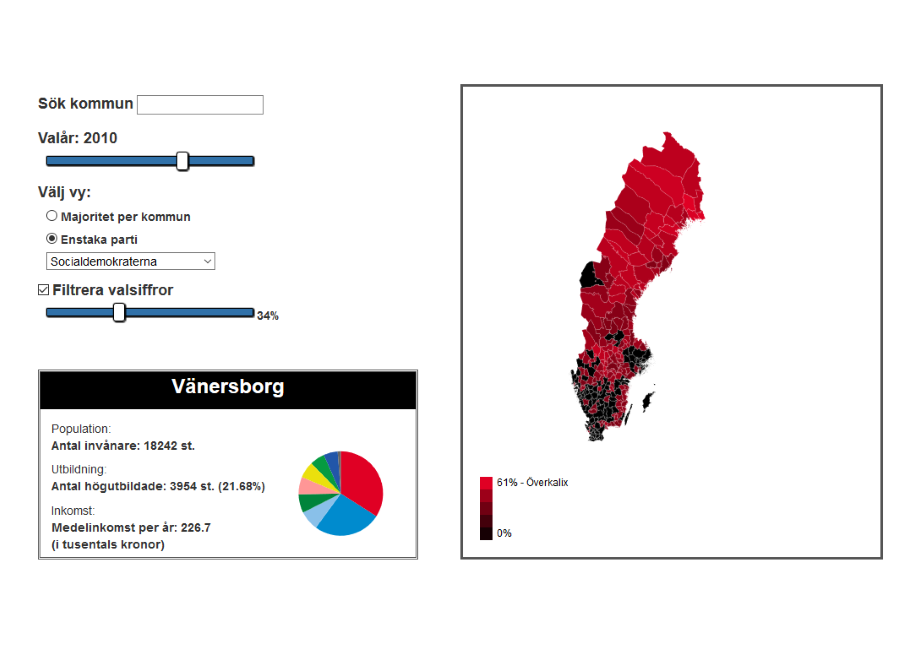
The application can visualise specific information for one municipality at a time, as well as giving information about the country as a whole. It uses datasets for the 2002, 2006, 2010 and 2014 elections.
The interactive demo works best using the Firefox web browser.
Related Terms:
D3.js - Javascript - Visualization